题源:
Sample Exam Questions.pdf的SAMPLE SET 1。参考答案与解析由 GPT-5.5 辅助生成,并结合本站课程笔记与计算复核整理;非官方答案,仅供参考。若与课堂讲解或官方答案冲突,以官方答案为准。标注“需人工复核”的题目表示存在题干、计算口径或官方预期答案的不确定性。
Section A: Multiple Choice Questions
(1.1) Which item below is correct regarding Design for Manufacturing (DFM): [2]
参考答案:D
DFM 的核心目标是让产品更容易制造和装配,从而降低制造复杂度、材料浪费和整体成本。
(1.2) There is a variety of actionable sustainable design principles that can be implemented to create better designs. Some of them are below except: [2]
参考答案:D
可持续设计通常鼓励延长产品寿命、减少材料和运输负担;“设计更短使用周期”与该方向相反。
(1.3) Which of the following 7QC tools can best be used to logically organize possible factors related to a specific problem by graphically displaying them in increasing detail and suggesting causal relationships among theories? [2]
参考答案:A
Cause-Effect Diagram 也叫 Fishbone/Ishikawa Diagram,用来按层次整理潜在原因并展示因果关系。
(1.4) Which model below is best used as a roadmap for Six Sigma to improve the quality of results produced by company processes? [2]
参考答案:A
Six Sigma 常用 DMAIC 作为改进现有流程的路线图。
(1.5) Project A has an NPV of USD 1.2 million; Project B has a BCR of 1.035; Project C has an IRR of -0.03 percent. Based on the information given, which project appears to be most attractive? [2]
参考答案:A(需人工复核)
NPV 为正且数额较大,BCR = 1.035 仅表示收益略高于成本,IRR 为负通常不可取。因此按题面“appears”判断 A 最有吸引力。严格财务比较中,不同指标和项目规模不可直接比较,若官方强调可比性,也可能接受 E。
(1.6) You are a project manager for an electrical manufacturing company involved in developing innovative components for renewable energy solutions. You have noticed that one of your team members is lacking knowledge in electronic component design. The same was communicated to him, and you tried sending him for training. However, the team member started arguing that he is an expert in electronic component design. Which of the following best describes this situation? [2]
参考答案:D
该成员实际能力不足,但没有意识到自己的能力缺口,因此属于 unconsciously incompetent。
(1.7) In a Profit and Loss (Income) statement, Earnings before Interest, Tax, Depreciation, and Amortization (EBITDA) is equal to: [2]
参考答案:D
在题目给出的简化口径下,EBITDA 可理解为 Gross Profit 扣除工资、租金等经营费用后、尚未扣除利息、税、折旧和摊销的收益。
(1.8) You are an engineer working on a project that depends on a new type of battery technology for success. During the development of the product, a report appears in a respected science publication that there may be health issues associated with the new battery technology if it leaks but they do not yet have reliable data. You are under pressure from your boss to complete your project, what do you do? [2]
参考答案:B
工程伦理中应采用预防原则,不能因为数据尚不充分就忽视潜在健康风险。
(1.9) If a company has an organizational structure shown below, it is called: [2]
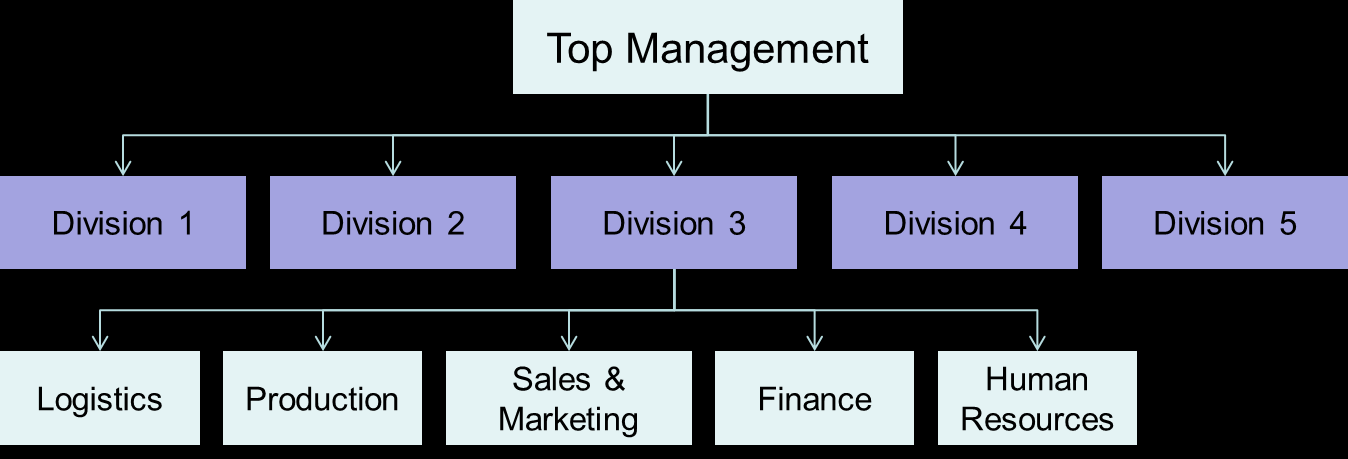
参考答案:C
图中 Top Management 下按 Division 1-5 分成事业部,并在事业部下配置职能部门,是典型 divisional structure。
(1.10) You have fifteen members in your engineering project team. You have called for a project status meeting without prior notice. During the meeting, there were too many side conversations and arguments. As a result, the team achieved very little in the meeting. To achieve orderliness in the meeting next time, you should: [2]
参考答案:B
会议无预先通知且无秩序,下一次应先发布议程,明确会议目标、主题和时间安排。
(1.11) A part of the cash flow with 30-days net payment terms for cash-in and cash-out is given in Table Q1 (1.11) below. Determine the cumulative cash towards the end of each month (M). The currency utilized for transactions in this cash flow is RMB. [2]
| M0 | M1 | M2 | M3 | M4 | M5 | |
|---|---|---|---|---|---|---|
| Sales Bookings | 10 | 12 | 8 | 20 | 100 | 0 |
| Shipments | 0 | 10 | 12 | 8 | 20 | 100 |
| Components Order | 5 | 6 | 4 | 10 | 50 | 0 |
参考答案:A
30 天账期下,当月现金流入来自上月 shipments,当月现金流出来自上月 components order。月度净现金流为 0, -5, +4, +8, -2, -30,因此累计为 0, -5, -1, +7, +5, -25。
(1.12) Based on Q1 (1.11) above, how do you classify the trading nature for such a type of cash-flow statements? [2]
参考答案:C
订单和出货增长较快,但采购支出先发生、回款滞后,导致累计现金在 M5 大幅转负。这是典型 over trading:销售扩张超过现金流承受能力。
Section B: Long Questions
Q2 [25 marks]
Q2(a) DFM 与可持续设计
A company is designing a new household appliance and is considering two possible designs for one of its components.
- Design A consists of five separate parts that need to be assembled.
- Design B integrates these parts into a single molded component.
(i) Discuss the advantages and disadvantages of each design from a Design for Manufacturing (DFM) perspective. [6]
(ii) Design A consists of five separate parts that need to be assembled, and one of these parts can be reused in other devices. Design B integrates all parts into a single molded component, making it smaller in size. In terms of actionable sustainable design principles, compare the two designs. [4]
(iii) The 4Rs, in particular, are a very effective tool in building a circular economy. They include four principles that can be applied by almost every individual and have an exponential effect. Distinguish the principles of the 4Rs that Design A and Design B primarily apply to promote the circular economy. [3]
展示参考答案
(i) DFM 比较
| 设计 | 优点 | 缺点 |
|---|---|---|
| Design A: 5 个独立零件 | 零件可单独替换;某些零件可复用;维修和升级更方便;模具或单件制造风险较低 | 零件数量多;装配步骤多;装配时间和人工成本高;误装、漏装和公差叠加风险更高;库存和供应链更复杂 |
| Design B: 单个模制件 | 零件数减少;装配步骤减少;制造和装配更快;尺寸更小;质量一致性更好;总体 DFM 更优 | 初始模具成本可能较高;设计修改更困难;某一局部损坏可能导致整个部件报废;复用和维修性较差 |
从 DFM 角度,若产品批量较大且设计稳定,Design B 通常更符合简化零件、减少装配和降低制造成本的原则。
(ii) 可持续设计比较
Design A 的优势是其中一个零件可在其他设备中复用,支持 reuse、维修、升级和延长零件生命周期;但它零件多、装配复杂,可能带来更多材料、运输、库存和装配资源消耗。
Design B 的优势是集成为更小的单一部件,支持 dematerialization,减少零件数量、装配能耗和潜在浪费;但它的可维修性和可复用性较弱,若局部损坏,可能需要替换整个组件。
(iii) 4Rs 对应
Design A 主要对应 Reuse,因为其中一个零件可以在其他设备中重复使用;也部分支持 Repair,因为独立零件更容易拆卸和更换。
Design B 主要对应 Reduce,因为单一模制件减少零件数量、材料使用和装配步骤。若材料选择支持回收,也可进一步支持 Recycle,但题干中最明确的是 Reduce。
Q2(b) Control Chart
The night shift operator recorded twenty current (mA) samples during electronic circuit testing. Evaluate whether the process is under control by utilizing a control chart, considering 2 * Sigma. Create a plot that clearly shows the sample points, central line, upper control limit (UCL), and lower control limit (LCL). [7]
| Sample | Current (mA) | Sample | Current (mA) |
|---|---|---|---|
| 1 | 510 | 11 | 505 |
| 2 | 516 | 12 | 511 |
| 3 | 500 | 13 | 500 |
| 4 | 495 | 14 | 498 |
| 5 | 505 | 15 | 501 |
| 6 | 500 | 16 | 500 |
| 7 | 510 | 17 | 490 |
| 8 | 505 | 18 | 505 |
| 9 | 500 | 19 | 507 |
| 10 | 499 | 20 | 500 |
展示参考答案
样本均值:
用样本标准差估计:
因为题目要求 2 * Sigma,控制界限为:
| 指标 | 数值 |
|---|---|
| Central Line | 502.85 mA |
| UCL | 514.94 mA |
| LCL | 490.76 mA |
作图时,横轴为 sample number 1-20,纵轴为 current (mA)。把 20 个样本点依次连线,并画三条水平线:CL = 502.85 mA、UCL = 514.94 mA、LCL = 490.76 mA。样本 2 和样本 17 应在图上突出标记为越界点。
样本 2 的电流为 516 mA,高于 UCL;样本 17 的电流为 490 mA,低于 LCL。因此该过程存在超出控制界限的点,不能认为过程处于统计受控状态。
若使用总体标准差,UCL/LCL 约为 514.64/491.06 mA,结论仍相同。
Q2(c) Process Capability
Assume that the manufacturer’s target for the process in (b) is 500 mA, with a tolerance of ±5 mA. Evaluate both process capability indices for this manufacturing operation. Discuss your findings. [5]
展示参考答案
规格界限:
使用 Q2(b) 的样本标准差 s = 6.046,过程能力指数为:
过程均值为 502.85 mA,偏向上规格限,因此:
结论:Cp < 1 表明过程自然波动范围大于规格范围,过程能力不足;Cpk 更低,说明过程均值还偏向 USL。该制造过程不能稳定满足 500 ± 5 mA 的规格,需要降低变异并把均值拉回目标值 500 mA。
注意:Q2(b) 已显示该过程不是统计受控过程,因此这里的 Cp/Cpk 只能作为描述性/初步计算。实际判断过程能力前,应先消除特殊原因并让过程稳定。
Q3 [25 marks]
Q3(a) Project Management 与 Quality
(i) John is overseeing the development of a new electronic device prototype. The most likely project duration is 10 months. In the best-case scenario, efficient collaboration with a specialized component supplier could reduce the duration by 2 months. However, a delay in obtaining critical components might extend the project by 3 months. Using the three-point estimating technique, calculate the expected project duration using both Triangular Distribution and Beta Distribution. Also, determine the standard deviation for each approach. [3]
展示参考答案
三点估算参数:
Triangular Distribution 的期望值:
Triangular Distribution 的标准差:
Beta/PERT Distribution 的期望值:
Beta/PERT Distribution 的标准差:
(ii) You are leading a project team consisting of 11 members. As the project transitions into the next phase, three new members join the team while two existing members depart. Based on these changes, determine the number of additional communication channels that will be created. [2]
展示参考答案
沟通渠道数量公式:
原团队 n = 11:
新团队人数为 11 + 3 - 2 = 12:
新增沟通渠道:
因此新增 11 条沟通渠道。
(iii) Assume an electronic product engineer has collected 10 observations for a specific product’s quality characteristic, which is nominally the best at a target value of 8.5. The engineer uses the Taguchi loss function where k = 1. Given Table Q3(a), compute the Taguchi loss function for each observation and determine the total loss. [3]
| Observation | Measurement | Observation | Measurement |
|---|---|---|---|
| 1 | 8.10 | 6 | 8.35 |
| 2 | 8.90 | 7 | 8.25 |
| 3 | 8.45 | 8 | 8.68 |
| 4 | 9.25 | 9 | 8.90 |
| 5 | 8.86 | 10 | 9.05 |
展示参考答案
Nominal-the-best Taguchi loss:
| Observation | y | Loss |
|---|---|---|
| 1 | 8.10 | 0.1600 |
| 2 | 8.90 | 0.1600 |
| 3 | 8.45 | 0.0025 |
| 4 | 9.25 | 0.5625 |
| 5 | 8.86 | 0.1296 |
| 6 | 8.35 | 0.0225 |
| 7 | 8.25 | 0.0625 |
| 8 | 8.68 | 0.0324 |
| 9 | 8.90 | 0.1600 |
| 10 | 9.05 | 0.3025 |
总损失:
平均损失为 0.15945。题目要求 total loss 时,应填写 1.5945。
(iv) You have been assigned as the project manager for the development of a basic embedded system for controlling a temperature sensor in a smart home application. The major phases of the project are planning, design, and testing. The WBS is decomposed down through these phases, where each phase is broken down into two additional activities at Level 2. Based on this, plot the WBS for the project, showing all three levels clearly. [4]
展示参考答案
参考 WBS:
Level 1: Smart Home Temperature Sensor Embedded System
├─ Level 2: Planning
│  ├─ Level 3: Define requirements and scope
│  └─ Level 3: Prepare schedule, budget, and risk plan
├─ Level 2: Design
│  ├─ Level 3: Hardware interface and sensor circuit design
│  └─ Level 3: Firmware architecture and control logic design
└─ Level 2: Testing
   ├─ Level 3: Unit and integration testing
   └─ Level 3: System validation and acceptance testing
评分重点是三层结构清楚:项目作为 Level 1,Planning/Design/Testing 作为 Level 2,每个阶段再拆成两个 Level 3 工作包。
Q3(b) CPM
Project schedule management includes the processes required to manage the timely completion of the project. Consider a project with the network diagram shown in Figure Q3(b) and answer the following questions.
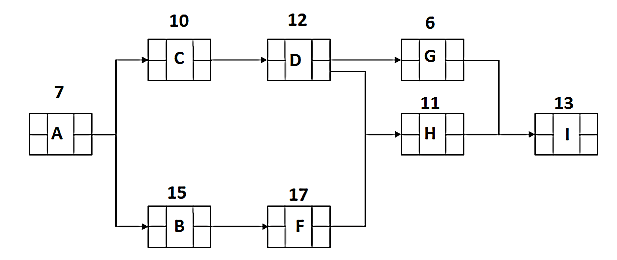
Text version of the activity data from Figure Q3(b):
| Activity | Duration | Predecessors |
|---|---|---|
| A | 7 | - |
| B | 15 | A |
| C | 10 | A |
| D | 12 | C |
| F | 17 | B |
| G | 6 | D |
| H | 11 | D, F |
| I | 13 | G, H |
(i) Perform the forward pass analysis through the schedule network and compute Early Start and Early Finish dates for all activities. [5]
(ii) Perform the backward pass analysis through the schedule network and compute Late Start and Late Finish dates for all activities. [5]
(iii) Calculate the total float (slack) for all activities. [2]
(iv) Define the Critical Path. [1]
展示参考答案
活动工期和依赖关系按图读取如下:
| Activity | Duration | Predecessors |
|---|---|---|
| A | 7 | - |
| B | 15 | A |
| C | 10 | A |
| D | 12 | C |
| F | 17 | B |
| G | 6 | D |
| H | 11 | D, F |
| I | 13 | G, H |
Forward pass:
| Activity | ES | EF |
|---|---|---|
| A | 0 | 7 |
| B | 7 | 22 |
| C | 7 | 17 |
| D | 17 | 29 |
| F | 22 | 39 |
| G | 29 | 35 |
| H | 39 | 50 |
| I | 50 | 63 |
Backward pass:
| Activity | LS | LF |
|---|---|---|
| A | 0 | 7 |
| B | 7 | 22 |
| C | 17 | 27 |
| D | 27 | 39 |
| F | 22 | 39 |
| G | 44 | 50 |
| H | 39 | 50 |
| I | 50 | 63 |
Total float:
| Activity | Total Float |
|---|---|
| A | 0 |
| B | 0 |
| C | 10 |
| D | 10 |
| F | 0 |
| G | 15 |
| H | 0 |
| I | 0 |
Critical Path:
项目总工期为 63。
Q4 [26 marks]
VRtuoso is a company that produces virtual reality (VR) headsets. Each headset comprises two specialized lenses. The company manufactures 0.6 Million (M) headsets annually. The lenses are provided by an external supplier for 675 RMB each. The company also has vacant production facilities with a fixed overhead cost of 39 M RMB. Currently, the vacant production facilities are rented out for 2 M RMB per year, but the renter may not renew the agreement.
Q4(a) Purchasing Cost Scenarios
Draw a table comparing the equivalent cost of purchasing a lens from the external supplier while the vacant production facilities are rented out vs. the scenario if the rental agreement is not renewed. [5]
展示参考答案
Annual headset quantity = 0.6 M.
Each headset uses 2 lenses, so annual lens quantity:
External purchase cost:
| Scenario | Lens purchase cost | Fixed overhead | Rental income | Annual equivalent cost |
|---|---|---|---|---|
| Facilities rented out | 810 M | 39 M | -2 M | 847 M RMB |
| Rental not renewed | 810 M | 39 M | 0 | 849 M RMB |
Equivalent cost per lens:
| Scenario | Cost per lens |
|---|---|
| Facilities rented out | 847M / 1.2M = 705.83 RMB |
| Rental not renewed | 849M / 1.2M = 707.50 RMB |
Q4(b) Make-or-Buy Decision
VRtuoso plans to use the vacant production facilities for manufacturing the lenses. In addition to the fixed overhead cost, the production cost breakdown for a lens consists of direct materials cost 325.00 RMB, direct labor cost 215.00 RMB, and variable overhead cost 127.50 RMB. Prepare a new cost table and decide whether VRtuoso should continue purchasing the lenses or start manufacturing their own lenses. [5]
展示参考答案
Variable manufacturing cost per lens:
Annual internal manufacturing cost:
| Option | Variable / purchase cost | Fixed overhead | Rental income | Total annual cost |
|---|---|---|---|---|
| Buy, rental not renewed | 810 M | 39 M | 0 | 849 M RMB |
| Make internally | 801 M | 39 M | 0 | 840 M RMB |
Internal manufacturing saves:
Therefore, if the rental agreement is not renewed, VRtuoso should manufacture the lenses internally. Even compared with the rented-out purchasing scenario in Q4(a), internal manufacturing is still cheaper by 847M - 840M = 7M RMB.
Q4(c) Cost and Revenue Table
If VRtuoso can sell the VR headsets for 1,413 RMB each, draw a table demonstrating production costs and sales revenue from 0 -> 1 M headsets with an increment size of 0.2 M. [6]
展示参考答案
Variable manufacturing cost per headset:
Total cost and revenue formulas:
where Q is the number of headsets.
| Q (M headsets) | Total Cost (M RMB) | Revenue (M RMB) | Profit (M RMB) |
|---|---|---|---|
| 0.0 | 39.0 | 0.0 | -39.0 |
| 0.2 | 306.0 | 282.6 | -23.4 |
| 0.4 | 573.0 | 565.2 | -7.8 |
| 0.6 | 840.0 | 847.8 | 7.8 |
| 0.8 | 1107.0 | 1130.4 | 23.4 |
| 1.0 | 1374.0 | 1413.0 | 39.0 |
Q4(d) Profit and Safety Margin
If the VRtuoso factory is running at full capacity of 0.6 M headsets per year with an assumed price of 1,413 RMB per headset, what is the profit made by VRtuoso? What is the safety margin? [5]
展示参考答案
At Q = 0.6M headsets:
Profit:
Break-even quantity:
Safety margin in units:
Safety margin percentage:
Safety margin in revenue:
Q4(e) Break-even Graph
Draw a Break-even graph showing Total Cost (TC), Variable Cost (VC), and Revenue (REV) against production quantity (Q). Calculate the Break-even Point and indicate this on the graph. [5]
展示参考答案
Graph lines to draw:
Break-even occurs where REV = TC:
At the break-even point:
When drawing the graph, use quantity Q on the x-axis and RMB on the y-axis. The Revenue line starts from zero with slope 1413; the TC line starts at 39M with slope 1335; the VC line starts from zero with slope 1335. Mark the intersection between REV and TC at 500,000 headsets, 706.5M RMB.