题源:
Sample Exam Questions.pdf的SAMPLE SET 4。参考答案与解析由 GPT-5.5 辅助生成,并结合本站课程笔记与计算复核整理;非官方答案,仅供参考。若与课堂讲解或官方答案冲突,以官方答案为准。
Section A: Multiple Choice Questions
(1.1) Which item below is correct regarding Design for Manufacturing (DFM)? [2]
参考答案:B
课程中强调大量产品成本在设计阶段被决定,因此 DFM 应在早期介入。
(1.2) Which statement accurately describes a cause-effect diagram? [2]
参考答案:D
Cause-effect diagram 是按类别和层级组织潜在原因的图形化工具。
(1.3) Which statement best describes the three pillars of sustainability? [2]
参考答案:B
可持续性要求经济、环境、社会三者平衡,并满足当前需求而不损害未来世代需求。
(1.4) Which of the following is not a project? [2]
参考答案:A
Regular updates 是持续运营/维护活动,不是临时性的独特项目。
(1.5) Which of the following is not true about the initial phase of a project? [2]
参考答案:A
项目初期不确定性和干系人影响最大,但成本投入通常较低,不是最高。
(1.6) Which statement about the WBS is most correct in project management? [2]
参考答案:E
WBS 是 Work Breakdown Structure,应覆盖项目 100% 工作;未包含在 WBS 中的工作属于范围外。
(1.7) Consider a start-up company run by an entrepreneur. Find the correct pair of true statements. [2]
1. Maximum standardisation and formalisation
2. Few layers: limited middle-line managerial levels
3. Decentralised and indirect supervision
4. Wide span of control around the entrepreneur
参考答案:D
初创企业层级少、形式化低,创业者直接监督且控制幅度宽。
(1.8) The following organisational structures should be labelled as: [2]
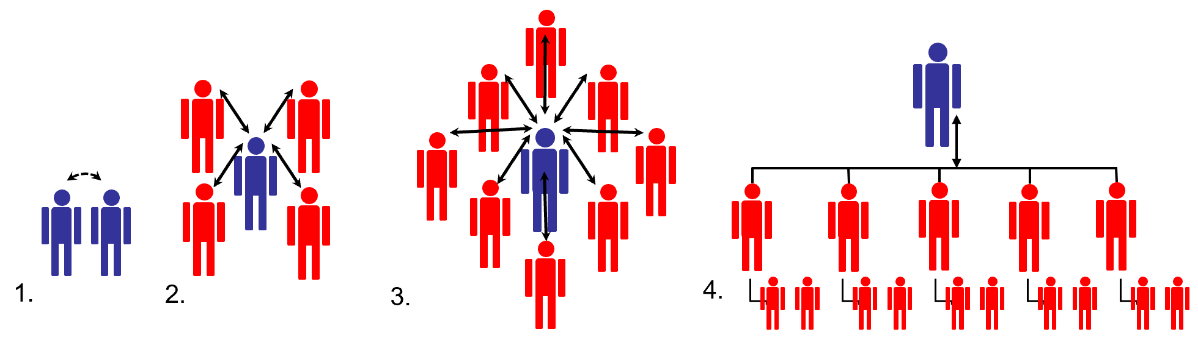
参考答案:A
四图对应从初创、扩张、增长到正式组织的结构演化。
(1.9) It costs 1000 RMB for hand tools and 1.50 RMB labour per unit. Automated machinery costs 15,000 RMB with 0.50 RMB per-unit cost. Annual production is 5000 units. How long to reach cross-over? [2]
参考答案:D
固定成本差 14,000,单位节省 1 RMB,交叉点 14,000 件;按 5,000 件/年为 2.8 年。
(1.10) A company sold 300,000 CNY of existing products costing 150,000 CNY to manufacture. A new product design cost 100,000 CNY to develop and is valued at 200,000 CNY. The new product replaces existing designs, so old designs are valued at 0. What is the present valuation? [2]
参考答案:A
按题干给出的净值计算:现有产品毛利为 300,000 - 150,000 = 150,000 CNY;新产品设计价值为 200,000 CNY;但开发该设计已花费 100,000 CNY,旧设计价值为 0。因此 present valuation = 150,000 - 100,000 + 200,000 = 250,000 CNY。
(1.11) Project risk management is best described as: [2]
参考答案:D
项目风险管理同时处理威胁和机会,目标是降低威胁影响并提升机会收益。
(1.12) Risk response planning consists of four main strategies. Which does not fall under the main strategies? [2]
参考答案:E
Identification 是风险识别过程,不是威胁应对策略;常见应对包括 avoid、transfer、mitigate、accept。
Section B: Long Questions
Q2 Discounted Cash Flow
As a young entrepreneur, you would like to guarantee a healthy total cost of ownership via evaluating net present value while utilising discounted cash-flow analysis.
(a) Your company is designing a new product that will take three years to design, fabricate, and build. Expenses are 1,000,000 RMB per year and increase with inflation of 5% annually. How much must your company quote for delivery in three years if it wants to cover expenses and earn net profit, in today’s equivalent currency, of 100,000 RMB? [3]
(b) Your company would like to purchase a new machine with purchase price 10 M RMB and lifetime 5 years. The machine requires annual maintenance cost 1 M RMB and annual power cost 0.5 M RMB. All costs are fixed, with inflation of 10% applied to power only after year 1.
(i) Demonstrate the total projected costs over the lifetime. [3]
(ii) Analyse the total cost of ownership over the lifetime. [4]
(c) Your company is considering a large assembly facility in Chengdu. Initial setup cost is 6,398 M RMB. Forecast net income is: Y1 1,400 M, Y2 1,450 M, Y3 1,550 M, Y4 1,625 M, Y5 1,480 M.
(i) Calculate projected payback time to the nearest month. [5]
(ii) Calculate NPV using a discount factor of 5%. [5]
(iii) Comment on attractiveness. [3]
(d) A cash-flow table with 30-day net payment terms is given below. Determine cumulative cash towards the end of each month M. Currency is RMB. [3]
| M0 | M1 | M2 | M3 | M4 | M5 | |
|---|---|---|---|---|---|---|
| Sales Bookings | 10 | 12 | 8 | 20 | 100 | 0 |
| Shipments | 0 | 10 | 12 | 8 | 20 | 100 |
| Components Order | 5 | 6 | 4 | 10 | 50 | 0 |
展示参考答案
(a) Quote for a three-year product
Expenses with 5% annual inflation:
| Year | Cost (RMB) |
|---|---|
| 1 | 1,000,000 |
| 2 | 1,050,000 |
| 3 | 1,102,500 |
| Total | 3,152,500 |
Profit target of 100,000 RMB in today’s money converted to year-3 money:
Required quote:
(b) Machine TCO
Power costs over five years: 0.500, 0.550, 0.605, 0.6655, 0.73205 M RMB. Total power cost = 3.05255 M RMB. Maintenance total = 5 M RMB. Including purchase cost:
(c) Chengdu facility
Cumulative income: Y1 1,400; Y2 2,850; Y3 4,400; Y4 6,025; Y5 7,505 M RMB. Remaining after year 4 is 373 M RMB, recovered in 373/(1480/12) = 3.02 months. Payback is about 4 years 3 months.
At 5% discount rate:
Positive NPV and payback within five years make the investment attractive, though the margin is modest.
(d) Cash flow with 30-day terms
| Month | Inflow | Outflow | Net cash | Cumulative cash |
|---|---|---|---|---|
| M0 | 0 | 0 | 0 | 0 |
| M1 | 0 | 5 | -5 | -5 |
| M2 | 10 | 6 | 4 | -1 |
| M3 | 12 | 4 | 8 | 7 |
| M4 | 8 | 10 | -2 | 5 |
| M5 | 20 | 50 | -30 | -25 |
Q3 DFM, QC, Robust Design, Process Capability
Q3(l) DFM and Sustainability
DFM is the process of designing components for ease of manufacturing high-quality products at a lower cost.
(vi) The product development cycle generally consists of initial design, final design, fabrication, production, and product launch. Draw a plot showing the effectiveness of DFM application versus these product development stages, based on both the impact and cost of changes. [4]
(vii) Sustainability can balance three main pillars. List any two of these pillars. [2]
展示参考答案
DFM effectiveness plot: DFM is most effective during initial design because design decisions have high impact and change costs are low. As the cycle moves through final design, fabrication, production, and product launch, the impact of changes falls while the cost of changes rises.
| Stage | Impact of DFM changes | Cost of changes |
|---|---|---|
| Initial design | Highest | Lowest |
| Final design | High | Low to medium |
| Fabrication | Medium | Medium |
| Production | Low | High |
| Product launch | Lowest | Highest |
In a sketch, draw one downward-sloping line for impact and one upward-sloping line for cost across the five stages.
Two sustainability pillars: Environmental, economic, and social are the three pillars; any two are acceptable.
Q3(m) 7QC and Control Chart
Which 7QC tool is sorted descending by frequency? Which tool studies process changes over time? Use the 15 yield rates to create a control chart and highlight instability. [8]
| Sample | Yield Rate (%) | Sample | Yield Rate (%) |
|---|---|---|---|
| 1 | 98.50 | 9 | 98.80 |
| 2 | 97.80 | 10 | 99.00 |
| 3 | 98.30 | 11 | 99.10 |
| 4 | 99.10 | 12 | 98.80 |
| 5 | 99.30 | 13 | 98.90 |
| 6 | 94.32 | 14 | 99.10 |
| 7 | 98.40 | 15 | 98.20 |
| 8 | 98.60 |
展示参考答案
Descending frequency bar chart: Pareto chart.
Process changes over time: Control chart.
For the yield data:
PDF 题干没有指定 2 * sigma,因此这里按常规 control chart 使用 3 * sigma 控制界限:
Sample 6 has yield 94.32%, which is below LCL. Therefore, the process shows uncontrolled variation and is unstable. On the plot, mark the central line at 98.4147%, UCL at 102.028%, LCL at 94.801%, and highlight sample 6 as an out-of-control point.
Q3(n) Robust Design
For a power supply circuit, target output voltage is 110 V. If output falls outside 110 ± 20 V, the stereo fails in half the situations and repair costs USD 100. Compute average Taguchi loss for output voltage 100 V. Explain how robust design improves quality. [5]
展示参考答案
At tolerance limit Δ = 20 V, expected loss is half of repair cost:
For nominal-the-best loss:
For y = 100 V, deviation from target is 10 V:
Average loss is therefore USD 12.50.
Robust design improves quality by making product performance less sensitive to noise factors. Instead of only inspecting defects after production, it designs parameter settings and tolerances so the output stays near target under real-world variation.
Q3(o) Process Capability
A component has parameter range 20 ± 1 mm; process mean is 19.8 mm; standard deviation is 0.2 mm. Calculate Cpk and assess risk. [6]
展示参考答案
Specification limits:
Cpk = 1.33 is generally acceptable/capable, but the mean is shifted below the target 20 mm, so the lower specification side is the limiting risk. The process should still be monitored and centered closer to 20 mm to reduce risk.
Q4 Project Management and CPM
Q4(c) Short Questions
(v) Project A has a BCR of 1.4. What can we infer? [2]
(vi) Difference between standard and regulation. [2]
(vii) Compare basic sender/receiver and interactive communication models. [4]
展示参考答案
(v) BCR = 1.4 means benefits are 1.4 times costs, or benefits are 40% above costs. The project is economically attractive if assumptions are valid.
(vi) A standard is a recommended or agreed technical/quality practice, often voluntary unless contractually required. A regulation is legally enforceable and issued by an authority; non-compliance can bring legal penalties.
(vii) The most basic sender/receiver model is sender → message → receiver. Extended versions also include encoding, channel, decoding, noise, and feedback. Interactive communication goes further by making feedback explicit and two-way: participants exchange messages in real time, clarify meaning, respond to feedback, and adjust communication dynamically. Meetings, calls, and workshops are typical interactive models.
Q4(d) CPM
| Activity | Duration | Predecessor(s) |
|---|---|---|
| A | 2 | - |
| B | 1 | - |
| C | 4 | - |
| D | 1 | A |
| E | 2 | B, C, D |
| F | 7 | C |
Plot CPM, perform forward and backward pass, calculate float, define critical path, and discuss a 1-day delay in C. [17]
展示参考答案
Network relationships:
A -> D -> E
B -> E
C -> E and F
Forward/backward pass:
| Activity | ES | EF | LS | LF | Float |
|---|---|---|---|---|---|
| A | 0 | 2 | 6 | 8 | 6 |
| B | 0 | 1 | 8 | 9 | 8 |
| C | 0 | 4 | 0 | 4 | 0 |
| D | 2 | 3 | 8 | 9 | 6 |
| E | 4 | 6 | 9 | 11 | 5 |
| F | 4 | 11 | 4 | 11 | 0 |
Project duration is 11 days.
Critical path:
Because activity C has zero float, a 1-day delay in C delays F and the project completion by 1 day. The project duration becomes 12 days, unless recovery actions are taken.